
Statistics and research release
Industry Statistics - Annual report - Financial year April 2025 to March 2026 - Official statistics
The latest statistics cover the period between April 2025 to March 2026.
Summary
Also published recently
- Industry Statistics – Quarterly report – Financial year April 2025 to March 2026, Quarter 4: Official statistics
- Industry Statistics – Quarterly report – Financial year April 2025 to March 2026, Quarter 3: Official statistics
- Industry Statistics – Quarterly report – Financial year April 2025 to March 2026, Quarter 2: Official statistics
Gambling Industry Statistics report on the size and shape of the customer facing gambling industry in Great Britain (GB).
This report provides an overview of Gross Gambling Yield (GGY) made by licensed gambling operators from GB gambling customers for each customer-facing sector, along with the numbers of licensed operators and premises. It is based on data reported to us by the operators we license and regulate. The accompanying data file includes figures for all sectors, based on data from April 2025 to March 2026, as well as historical data back to the financial year ending March 2009.
Industry statistics interactive dashboard
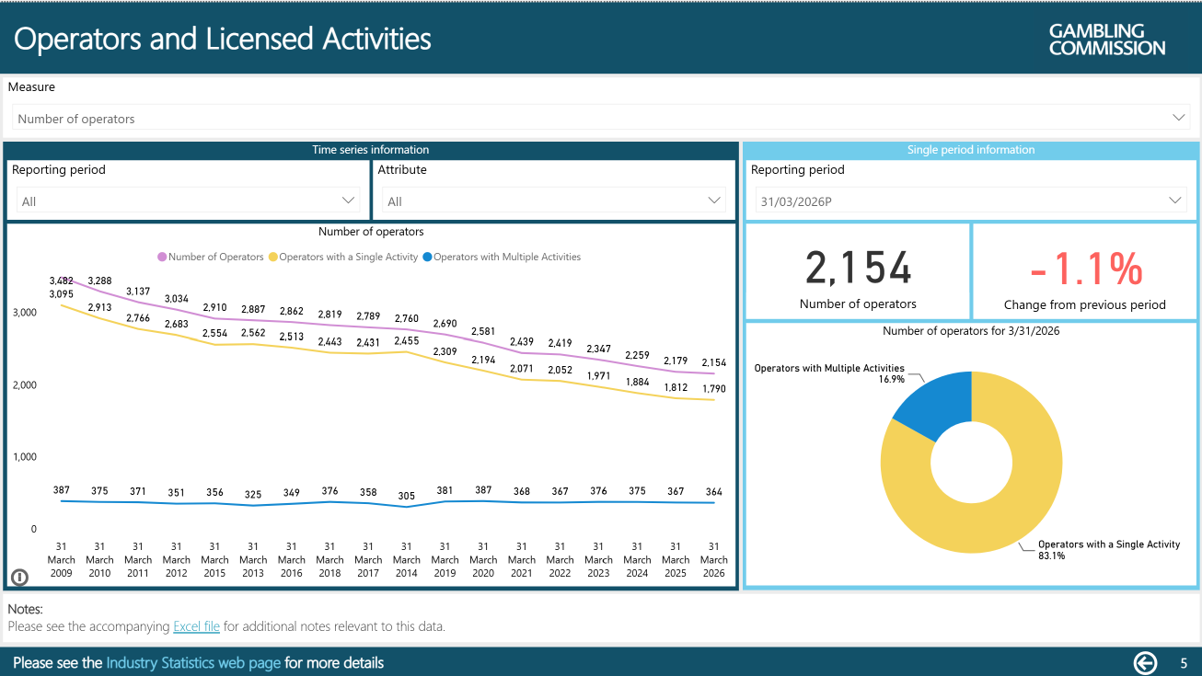
View our Gambling Industry Statistics September 2026 interactive dashboard (opens in new tab)
With this dashboard, you can:
- view and interact with the data
- apply filters to select information of interest.
Accessibility of this dashboard
This dashboard is in Microsoft Power BI which may not fully support all accessibility needs. You can find the source data in Industry Statistics – Annual report – Financial year April 2025 to March 2026 (downloads as Excel file).
Some files may not be accessible for users of assistive technology. If you require a copy of the file in an accessible format contact us with details of what you require. It would help us to know what technology you use and the required format.
Key facts
£17.5 billion - Total gross gambling yield (GGY) of the customer facing gambling industry in Great Britain (April 2025 to March 2026) (4.4 percent increase on April 2024 to March 2025)
£13.2 billion - Total gross gambling yield (GGY) of the customer facing gambling industry in Great Britain (excluding all reported lotteries) (April 2025 to March 2026) (4.7 percent increase on April 2024 to March 2025)
8,081 - Total number of licensed gambling premises in Great Britain (April 2025 to March 2026) (2.0 percent decrease on April 2024 to March 2025)
5,617 - Total number of betting shops in Great Britain (April 2025 to March 2026) (3.6 percent decrease on April 2024 to March 2025)
£8.3 billion – Total GGY for Remote Casino, Betting and Bingo Sector (RCBB) (April 2025 to March 2026) (6.9 percent increase increase on April 2024 to March 2025)
£4.9 billion - Total GGY for Land-based Sectors (Arcades, Betting, Bingo and Casino) (April 2025 to March 2026) (1.1 percent increase on April 2024 to March 2025)
£2.7 billion - Total GGY for gaming machines in Great Britain (April 2025 to March 2026) (4.3 percent increase on April 2024 to March 2025)
£1.6 billion - Contributions to good causes from The National Lottery (April 2025 to March 2026) (2.8 percent increase on April 2024 to March 2025)
£498.5 million - Contributions to good causes from large society lotteries (April 2025 to March 2026) (2.8 percent increase on April 2024 to March 2025)
2,154 - Gambling operators in the market (31 March 2026) (1.1 percent decrease on 31 March 2025)
3,097 - Gambling activities licensed (31 March 2026) (0.4 percent increase on 31 March 2025)
Details
Remote Gambling
Remote Casino, Betting and Bingo (RCBB) accrued £8.3 billion GGY which can be broken down into 3 individual areas:
- online casino games dominate the sector, generating £5.7 billion in GGY, £4.8 billion of which was from slots games
- GGY for remote betting totalled £2.4 billion, led by football (£1.2 billion) and betting on horse racing (£769.3 million)
- GGY for remote bingo totalled £147.8 million.
This financial year saw a decrease in the number of new account registrations with RCBB operators (down 3.0 percent to 32.4 million). The number of active accounts at the end of the last reporting quarter was 25.7 million. The total funds held in customer accounts was £886.6 million at the end of the last reporting quarter. This is a 13.9 percent decrease on the same period last year.
Non-remote Gambling
Non-remote betting GGY was £2.4 billion, a 3.3 percent decrease on the previous financial year. Within off-course data, machines GGY decreased by 0.9 percent to £1.2 billion. Machines represented 49.4 percent of total GGY in the non-remote betting sector. The number of betting premises has continued to decline for the 12th consecutive reporting period to 5,617. That is a decrease of 208 (3.6 percent) on March 2025.
The non-remote casino sector saw a £3.6 million increase (0.4 percent) in GGY to £933.9 million (casino games at £695.0 million and casino machines at £238.9 million) for this last financial year.
Non-remote bingo GGY was £703.8 million, an 8.2 percent increase. This constitutes £242.1 million for bingo games and £461.7 million for bingo machines.
Non-remote arcades GGY was £800.1 million, a 10.7 percent increase. £761.4 million (up 11.3 percent) for adult gaming centres and £38.6 million (down 0.5 percent) for family entertainment centres. Note that this data does not include family entertainment centres which operate using a permit from a local authority.
Lotteries
The National Lottery ticket sales totalled £7.9 billion (increase of 0.9 percent on previous financial year), of which £4.5 billion was returned as prizes (decrease of 0.6 percent) and the contribution to good causes totalled £1.7 billion (increase of 2.8 percent).
Large society lotteries ticket sales totalled £1.2 billion (increase of 5.7 percent on previous financial year), of which £335.6 million was returned as prizes (increase of 6.1 percent) and the contribution to good causes totalled £498.5 million (increase of 2.8 percent).
Notes
This publication is primarily for anyone who has an involvement or interest in the gambling industry including government, licensed operators, trade bodies, international regulators, journalists, academic researchers, financial institutions, statisticians, consumers, and local authorities.
About the status of official statistics.
Read about how we prepare our industry statistics.
In July 2024 changes were made to the way operators report data through their regulatory returns. These changes include the frequency of submitting regulatory returns being harmonised so that all operators reporting periods are the same (1 April to 30 June, 1 July to 30 September, 1 October to 31 December, 1 January to 31 March) and the removal of questions from returns. Full details can be found in the Regulatory returns changes – effective from 1 July 2024.
We will publish the next annual industry statistics in Autumn 2027. These will cover the period from April 2026 to March 2027.
Going forward we will also publish an updated version of the core industry statistics using data collected through regulatory returns on a quarterly basis.
Licensed premises interactive dashboard
Industry Statistics include aggregated premises data that operators report to us each quarter. As well as this operator data, we also publish a more detailed Register of gambling premises which is derived from data provided by local authority licensing teams.
We know the numbers sometimes differ, especially the number of betting shops, because the premises register still includes some inactive premises. As this register is a valuable source of information for lots of people, we are working to improve data quality. We have now incorporated this data into a Licensed Premises dashboard. This dashboard uses premises data extracted on 30 June 2026.
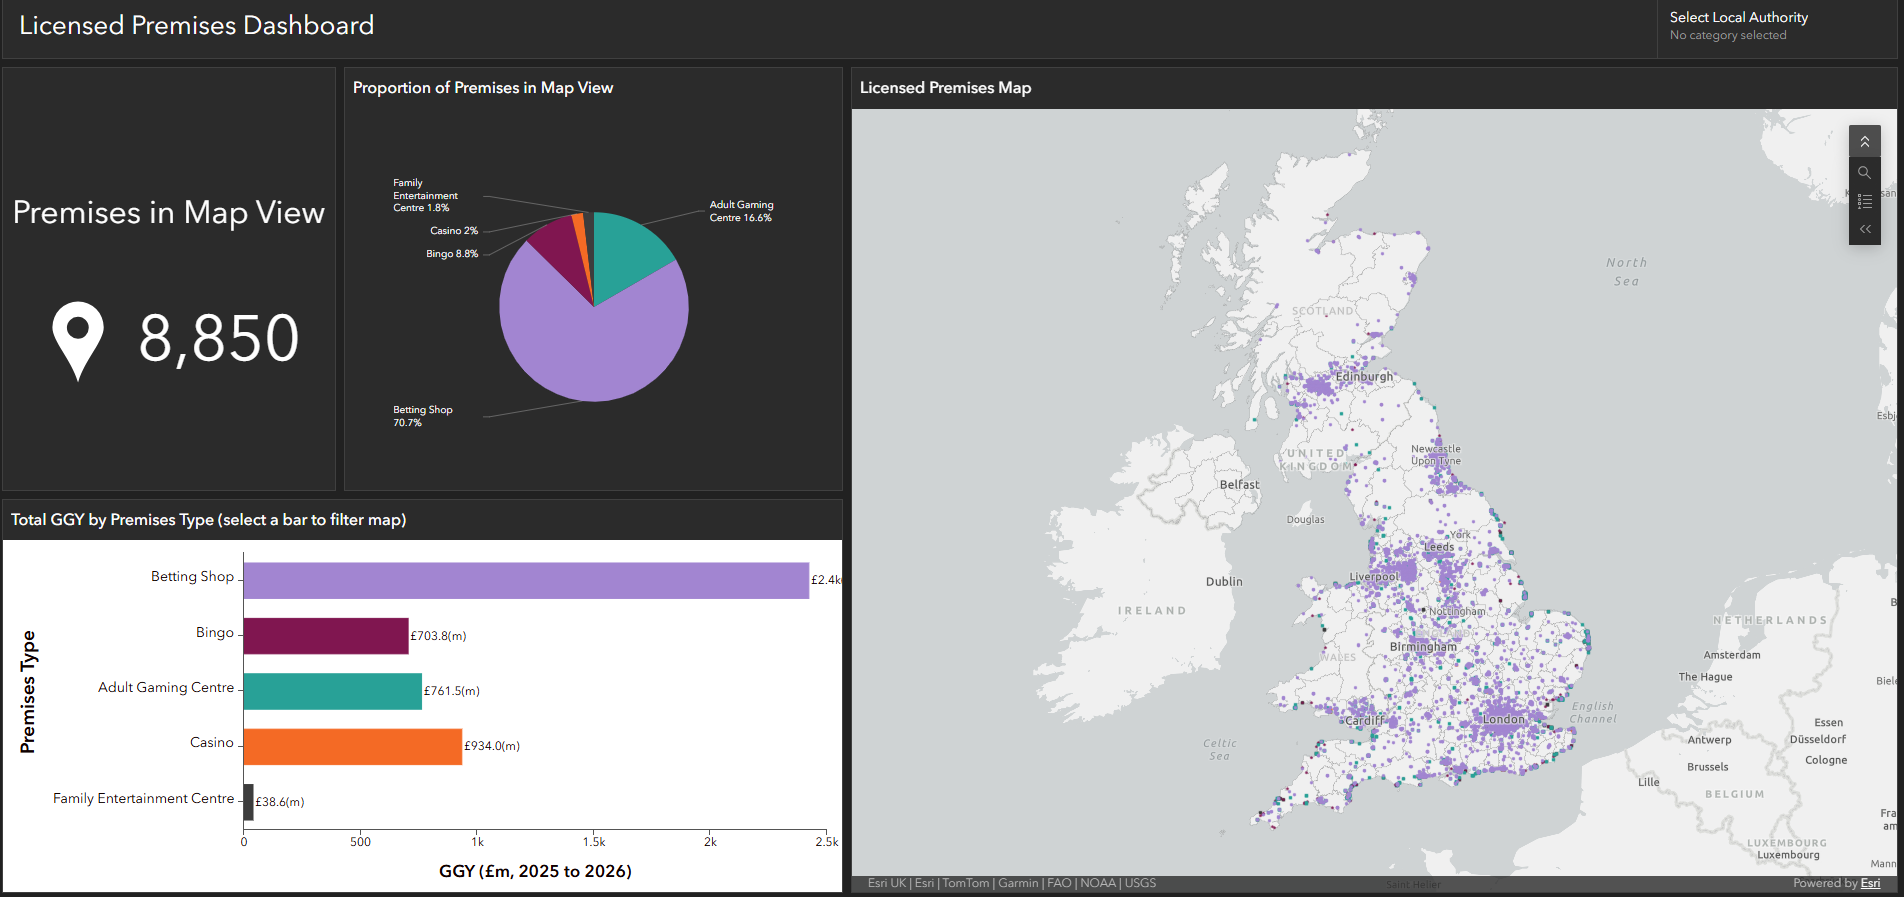
View our Licensed Premises interactive dashboard (opens in new tab)
With this dashboard, you can:
- pan or zoom the map to view locations
- select a local authority from the 'Select Local Authority' menu. Select the Local Authority again to reset the view
- select the individual bars in the graph to filter the other elements on the dashboard (the graph remains an overall total and does not adjust when the map is filtered).
Accessibility of this dashboard
This dashboard is in esri ArcGIS which may not fully support all accessibility needs. You can find the source data in Industry Statistics – Annual report – Financial year April 2025 to March 2026 (downloads as Excel file) and the Register of gambling premises.
Some files may not be accessible for users of assistive technology. If you require a copy of the file in an accessible format contact us with details of what you require. It would help us to know what technology you use and the required format.
Data and downloads
Files
Feedback
We are always keen to hear how these statistics are used and would welcome your views on this publication.